
Performance Testing,
a Data Challenge
Reducing large amounts of data to key metrics without losing too much information
René Schwietzke, Xceptance GmbH
About Xceptance
- Founded 2004, Offices in Jena and Erfurt, Germany
- Subsidiary in Cambridge, MA, USA
- 50+ Employees
- Focused on Software Test and Quality Assurance
- Performance Testing, Test Automation, Functional Testing, QA, and Test Process Consulting
- Mostly Active in Ecommerce and Internet
- Own Open Source Tooling Test Tool XLT (
 ) - https://github.com/Xceptance/XLT

About René Schwietzke
- Co-Founder and Managing Directory Xceptance
- Master of Computer Science (in German: Dipl.-Inf.)
- Programmer Since 1992
- In QA and Test Since 1998
- Performance Tester Since 1999
-
@ReneSchwietzke #java #qa #test #performance #performancetest #quality #automation

What is Performance Testing?
Quick Peak at the Basics
Performance Testing 101
A response in a nutshell
- Goal: Gain confidence and knowledge, learn to know and trust the system. Ensure it can fullfil the business requirements.
- Why? Get a comprehensive picture of the system's performance, stability, and scaling behavior.
- How? Use a load test tool to create an accurate simulation of its future usage and measure the system's behavior. This is mostly a black box view.
- Result: See the behavior of interactions with the system, see any changes over time as well as situations that might trigger certain types of errors.
The Audience - A Diverse Crowd
Who consumes the results and why?
- Engineering: Starts precisely planned, loses focus quickly, cannot sell results to higher levels without causing uncertainty or unwanted discussions
- Eng/QA: Don't talk the same language when talking about results
- Eng Management: Asks technical questions about the testing over and over again because it does not understand the results or doubt them
- Product Management: Too much data
- Sales: Give us a number, one number only please.
- Services: Was it our fault?
- Implementation Partners: Does it work and is there anything to do?
- Merchants: Will we succeed?
Performance Testing - The Numbers
What are we looking for?
Given Requirements
- Visits/h - 100,000
- Page Views/h - 1 million
- Orders/h - 3,500
- Runtime Average - 250 ms
- Runtime P99.9 - 500 ms
- Runtime Max - 3,000 ms
- Lot of vage ideas
Results
- Achieved Visits
- Achieved Page Views
- Achieved Orders
- Runtimes and if they match expectations
- Errors count and error picture
- Stability and development over time
The Data
All the Numbers We Are Dealing With
Data Capturing
What data can we capture (not only measure)
- DNS
- Connect
- TLS
- Sending/Busy/Receiving
- Closing
- Bytes Sent/Received
- URL
- Method
- Parameters
- State / Response
- TTFB (indirect)
- TTLB (indirect)
Beyond HTTP
- Source-IP/Agent
- User Type Sending It
- Action Triggering It
Raw Data
A collected example
R,QuickView.1,1571927593069,112,false,1593,6096,200,https://host/842177173640.html?cgid=sales,text/html,0,0,111,0,111,111,,,,,0,,
R,QuickView.2,1571927593184,79,false,1639,592,200,https://../Wishlist?productID=842177173640,application/json,0,0,79,0,79,79,,,,,0,,
A,QuickView,1571927593064,199,false
R,AddToCart.1,1571927597981,263,false,1727,3889,200,https://host/Cart-AddProduct?format=ajax,text/html,0,0,260,1,260,261,,,,,0,,
A,AddToCart,1571927597981,264,false
T,TOrder,1571927533453,100982,false,,
The Result
It could be so simple
Requirement
500 ms or faster
Result
321 ms
Plus Time
Turn the point into a line by adding a dimension

Context is Everything
We are looking for more than just single numbers
- Direct Timeline: When in time (absolute timestamp)
- Indirect Timeline: When within a visit (relative view)
- Direct Context: Type of request (homepage, search...), Parameters, Method (GET, POST...)
- Indirect Context: First request, same request type but different parameters, repeated request but with different server state (cart size, login state)...
- Location: Datacenter, Region (EMEA, NA, APAC), Country, Machine (IP), Agent (load test process)
- Remember, black box testing aka we don't have a target context most of the time.
Plus Another Context


Let the Data Flow
Just collect
How Much Data is That?
A standard load test result of a large US customer
Business Perspective
- Runtime: 3 hours
- User Types: 17
- Visits: 5,266,130
- Page Interactions: 55,462,101
- Orders: 677,606
- Total Requests: 122,185,828
- Errors: 70,491
- Datacenters: 7
- Load Generators: 50 / 800 Cores / 1.6 TB Memory
Tool Perspective
- Data Lines: 189,751,960
- Transactions: 5,266,130
- Actions: 55,925,554
- Requests: 122,185,828
- Events: 124,519
- Custom: 5,232,721
- Agent: 53,409
How many data points?
How many data points are captured?
Base
| Transaction | 9 |
| Action | 5 |
| Request | 23 |
| Custom | 5 |
| Event | 5 |
| Agent | 23 |
Totals (Example)
| Transaction | 47,395,170 |
| Action | 279,627,770 |
| Request | 2,810,274,044 |
| Custom | 622,595 |
| Event | 26,163,605 |
| Agent | 1,228,407 |
| Total | 3,165,311,591 |
How Much Data is That?
These numbers show the dimensions
- Uncompressed Data: 48.72 GB
- Compressed Data: 4.10 GB
- Lines per Second: 17,569
- Datapoints per Second: 293,084
Process and Sell the Data
Our Result and Communication Challenge
Quick Example
A data example
Test time: 1 h - Total: 14,645 - Mean: 174 ms - P95: 210 ms - P99: 250 ms - Max: 1,169 ms - P99.9: 480 ms
The Average is my friend
Is the average good enough?
Test time: 8 h - Total: 6,796 - Mean: 156 ms - P95: 730 ms - P99: 1,610 ms - Max: 6,592 ms - P99.9: 4,930 ms
Which PXX
Which PXX might be a good vehicle for the message?
Test Time: 3h 30 m - Total: 114,386 - Mean: 504 ms - P95: 550 ms - P99: 2,660 ms - Max: 6,169 ms - P99.9: 4,280 ms
What do we use
What is our final communication data set?
Numbers
- P95: The number to rule it all, grouped by type such as catalog, cart, homepage, or checkout
- Avg: To get a feel for the deviation and what could be delivered under normal circumstances
- Error Count: To make sure the numbers are not void
- Max: To see the worst case
Time Dimension
- There is no simple way to display development over time
- Resorting to a visual chart for the moment
- What to draw? All points, some points, or averages?
- Displaying all points turns the chart into a mess
- The moving average either hides details or runs behind
- Settling for a one second resolution and displaying min and max for that second plus all points in small buckets
- Purpose: See patterns and events, enhancing trust in the single number that forms the communication
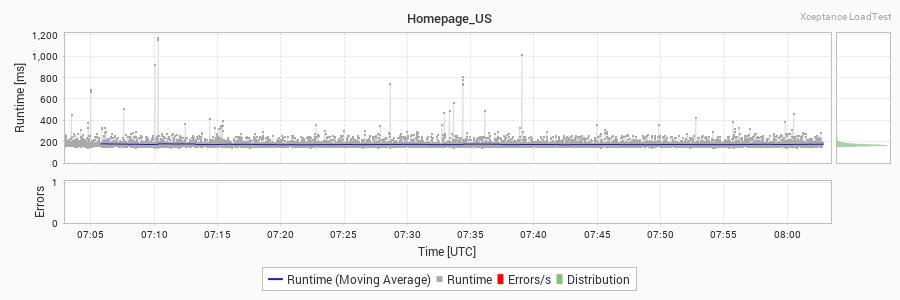
Chart Example


Test time: 1 h - Total: 112,695 - Mean: 501 ms - P50: 250 ms - P95: 1,950 ms - P99: 5,170 ms - Max: 16,689 ms - P99.9: 7,830 ms
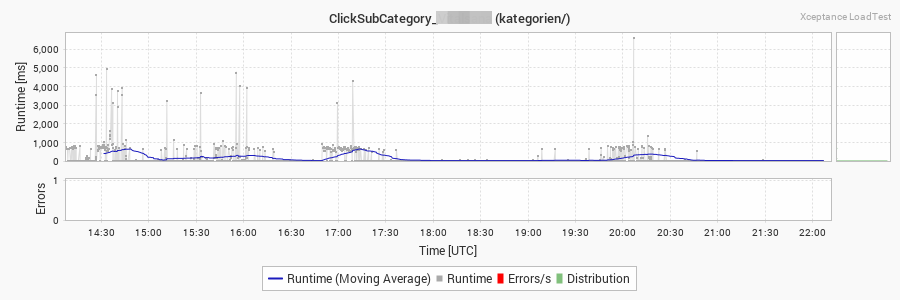
Chart Example - More Drastic


Test time: 3 h - Total: 3,145,233 - Mean: 669 ms - P50: 250 ms - P95: 2,760 ms - P99: 8,740 ms - Max: 35,945 ms - P99.9: 30,020 ms
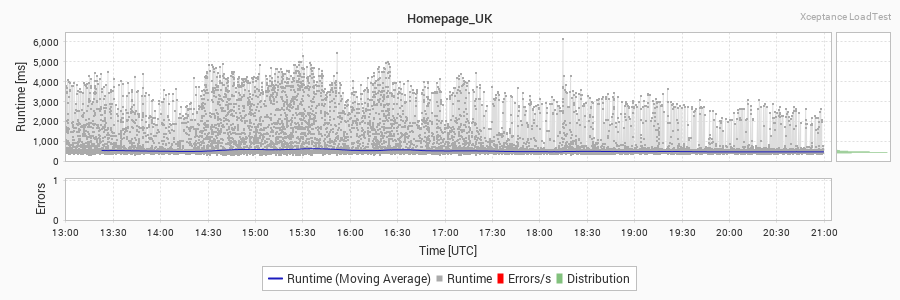
Chart Example - Caches


The Data Table

Why all that data?
Does it makes sense to collect 10x more data than needed?
- A load test can be expensive
- The execution window might have passed
- The next run might not yield the same results
- The environment might have changed (software, hardware, data)
- Results are often the trigger for a more detailed analysis, getting the same results is mostly impossible
- Problems are often time and event based, hence you have to know the question but you got only the response
- Therefore, every report is produced offline and can be "reshaped" if needed
- Raw data is available to look for details beyond a regular report
About the Data Processing
Some More Technical Stuff
The Data Crunching
How we crunch the data
- Multi-threading offline process
- Converts data from CSV to XML/HTML/charts
- Multi-threaded parsing
- Multi-threaded filtering and merging
- Single threaded summation and timeline building
- Multi-threaded chart creation
- Process is repeatable and movable
- Takes 6 min on an 8-core machine (our 3.2 billion points set)
- Tuned version needs 3 min
- Processing 1,189,712 lines/s on a Thinkpad T14s (8+8 cores)
- Filtering and merging is most expensive
- Summation cannot be scaled at the moment
There is Still Room
There is More That can be Done
What might be possible
Ideas for Master and Bachelor Theses
- Realtime analysis or at least realtime queries
- Better charts with more details or less noise - Visualization!
- Identification of patterns and events without manual chart analysis
- Making things even faster or scale better
- Making static charts interactive without a backend
Q & A
Thank you very much!