
Performance Test Report
Load Profile
This section shows the load profile as configured in the properties files of your test suite.
| Transaction Name | Users | Iterations | Arrival Rate [1/h] | Initial Delay | Ramp-Up Period | Warm-Up Period | Measurement Period | Shutdown Period | Think Time [ms] |
|---|---|---|---|---|---|---|---|---|---|
| Totals (9 entries) | 460 | – | 9...11,800 | – | 00:05:00 | – | 01:05:00 | 00:01:00 | 3,000...7,000 |
| TAccountCreation | 40 | – | 1...1,000 | – | 00:05:00 | – | 01:05:00 | 00:01:00 | 3,000...7,000 |
| TAddToCart | 80 | – | 1...2,000 | – | 00:05:00 | – | 01:05:00 | 00:01:00 | 3,000...7,000 |
| TBrowse | 80 | – | 1...2,000 | – | 00:05:00 | – | 01:05:00 | 00:01:00 | 3,000...7,000 |
| TGuestCheckout | 40 | – | 1...1,000 | – | 00:05:00 | – | 01:05:00 | 00:01:00 | 3,000...7,000 |
| TGuestOrder | 40 | – | 1...800 | – | 00:05:00 | – | 01:05:00 | 00:01:00 | 3,000...7,000 |
| TRegisteredCheckout | 40 | – | 1...1,000 | – | 00:05:00 | – | 01:05:00 | 00:01:00 | 3,000...7,000 |
| TRegisteredOrder | 40 | – | 1...1,000 | – | 00:05:00 | – | 01:05:00 | 00:01:00 | 3,000...7,000 |
| TSearch | 80 | – | 1...2,000 | – | 00:05:00 | – | 01:05:00 | 00:01:00 | 3,000...7,000 |
| TVisit | 20 | – | 1...1,000 | – | 00:05:00 | – | 01:05:00 | 00:01:00 | 3,000...7,000 |
Test Comment
General Information
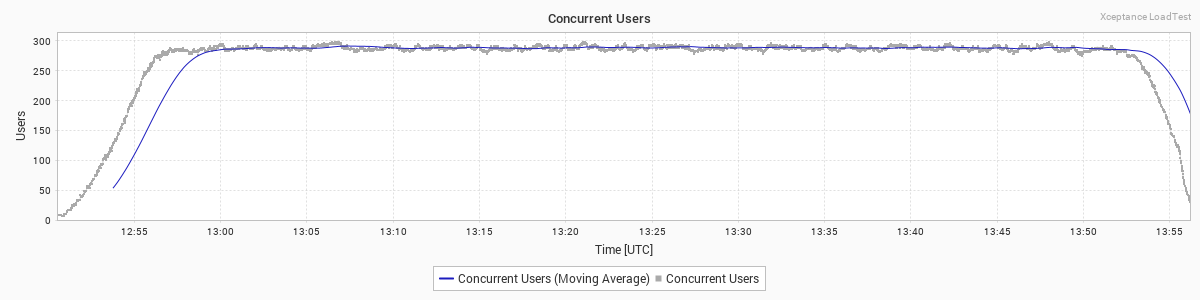
Below you find basic characteristics of the load test: start time, end time, and total duration. The charts depict the number of concurrent users, requests per second, the request runtime, and the number of errors per second.
| Test Duration [hh:mm:ss] | Test Start | Test End |
|---|---|---|
| 01:05:00 | 2023-03-15 12:50:31 UTC | 2023-03-15 13:55:31 UTC |


Agent Summary
The Agent Summary shows you the CPU usage status of all your agent machines. This allows you to quickly see if there are any problems that may or may not have negatively affected the load test result.

Performance Summary
To help you evaluate the test results quickly and easily, this table gathers general performance characteristics: the traffic volume the test created, the number of errors and events, and runtime numbers.
| Summary | Count | Errors | Events | Runtime [ms] | Runtime Percentiles [ms] | ||||||||||
|---|---|---|---|---|---|---|---|---|---|---|---|---|---|---|---|
| Total | 1/s | 1/h* | 1/d* | Total | % | Total | Mean | Min. | Max. | Dev. | P50 | P95 | P99 | P99.9 | |
| Transactions | 10,979 | 2.8 | 10,137 | 243,289 | 0 | 0.00% | 0 | 95,247 | 400 | 419,735 | 90,462 | 52,340 | 255,660 | 339,080 | 393,550 |
| Actions | 213,336 | 54.7 | 196,976 | 4,727,425 | 0 | 0.00% | – | 204 | 95 | 3,923 | 196 | 130 | 540 | 1,010 | 2,070 |
| Requests | 233,029 | 59.8 | 215,159 | 5,163,813 | 0 | 0.00% | – | 181 | 94 | 3,575 | 172 | 130 | 510 | 900 | 1,890 |
| Custom Timers | 29,313 | 7.5 | 27,065 | 649,562 | 0 | 0.00% | – | 126 | 5 | 3,042 | 166 | 110 | 340 | 760 | 1,870 |
Network
See below for data on the incoming and outgoing traffic during the load test. More...Hide...
The data is captured right above the network layer, thus it comprises all traffic information including potential overhead due to encryption as well as savings due to compression. Depending on the test runtime, the numbers per hour and per day may be estimates based on a linear projection of the available data.
*) Numbers may be projected
| Total | 1/s | 1/min | 1/h* | 1/d* | |
|---|---|---|---|---|---|
| Requests | 233,029 | 60 | 3,585 | 215,104 | 5,162,489 |
| Bytes Sent | 168.2 MB | 44.2 KB | 2.6 MB | 155.3 MB | 3.6 GB |
| Bytes Received | 691.3 MB | 181.5 KB | 10.6 MB | 638.1 MB | 15.0 GB |
This is a test with a scaled DB 2x